Wealth gap is worse than you think

Economists Emmanuel Saez, of the University of California–Berkeley, and Gabriel Zucman, of the London School of Economics, are out with a new set of findings on American wealth inequality, and their numbers are startling. Wealth, for reference, is the

value of what you own—assets like housing, stocks, and bonds, minus your debts. And while it certainly comes up from time to time, it has

images-1

tended to play second fiddle to income in conversations about America’s widening class divide. In part, that’s because it’s a trickier conversation subject. Wealth has always been far more concentrated than income in the United States. Plus, research suggested that the top 1 percent of households had actually lost some of its share since the 1980s.That might not really have been the case.

Forget the 1 percent. The winners of this race, according to Zucman and Saez, have been the 0.1 percent. Since the 1960s, the richest one-thousandth of U.S. households, with a minimum net worth today above $20 million, have more than doubled their share of U.S. wealth, from around 10 percent to more than 20 percent. Take a moment to process that. One-thousandth of the country owns one-fifth of the wealth. By comparison, the entire top 1 percent of households takes in about 22 percent of U.S. income, counting capital gains.

While the super-rich have risen, the merely affluent have barely budged. As shown on this next graph from Saez and Zucman, the share of wealth belonging to the top 1 to 0.5 percent of households has remained about level. The 0.5 to 0.1 percent have tacked roughly an extra percentage point onto their piece of the pie. The relative gains have been eaten up by the elite—the 0.1 percent and even the 0.01 percent. Continue reading “Wealth gap is worse than you think”

Stereotypes of LGBT affluence

Despite a commonly held belief that LGBT Americans tend to live it up in classy urban neighborhoods, they struggle with disproportionately high levels of poverty compared to straight people.Excerpted below, Nathan McDermott writes in today’s issue of The Atlantic about misperceptions of LGBT wealth and poverty:

imgres

“Who are America’s gays? To hear it as Supreme Court Justice Antonin Scalia would have it, gays are a privileged set, living it up in cities across the country. As the justice wrote in his dissent to Romer v. Evans—a landmark 1996 case that overturned a Colorado state constitutional amendment prohibiting legal protections for gays and lesbians—“Those who engage in homosexual conduct tend to reside in disproportionate numbers in certain communities.” Even more ominously, to Scalia, they have “high disposable income,” which gives them “disproportionate political power… to [achieve] not merely a grudging social toleration, but full social acceptance, of homosexuality.”

“The pernicious insinuation—that gays and lesbians are one the wealthiest demographics in the country—isn’t a new cliché. Some of the most ingrained public images of LGBT people are their cosmopolitan, highfalutin lifestyle; gays, so the story goes, live in gentrified urban neighborhoods like The Castro in San Francisco or Chelsea in New York, eat artisanal cheese, and drink $12 cocktails.

“But like most stereotypes, the myth of gay affluence is greatly exaggerated.

“In reality, gay Americans face disproportionately greater economic challenges than their straight counterparts. A new report released by UCLA’s Williams Institute found that 29 percent of LGBT adults, approximately 2.4 million people, experienced food insecurity—a time when they did not have enough money to feed themselves or their family—in the past year. In contrast, 16 percent of Americans nationwide reported being food insecure in 2012. One in 5 gays and lesbians aged 18-44 received food stamps in the last year, compared with just over 1 in 4 same sex couples raising children. The LGBT community has made huge political strides over the past decade, but in economic matters they still lag far behind the rest of the country. Continue reading “Stereotypes of LGBT affluence”

Art grads, good jobs & happiness

Think that art school dooms graduates to a life of unemployment? The numbers paint a very different picture, reports none other than the Wall Street Journal

“Artists can have good careers, earning a middle-class income,” says Anthony Carnevale, director of Georgetown University’s Center on Education and the Workforce. “And, just as important and maybe more, artists tend to be happy with their choices and lives.”

“A 2011 report from the center found that the unemployment rate in the first two years for those graduating with bachelor of fine arts degree is 7.8%, dropping to 4.5% for those out of school longer. The median income is $42,000.”Artists’ income is comparable to other liberal-arts majors,” he says. “They do a little better than psychology majors, since counseling and social work is a very low-wage occupation.” For artists who go on to graduate degrees, the most common of which is the master’s of fine arts, the unemployment rate for recent graduates drops to just under 5%, and their median yearly income increases to roughly $50,000.

“Other studies have also found relatively high levels of employment and satisfaction. The Curb Center for Art, Enterprise and Public Policy at Vanderbilt University conducted a survey of 13,000 graduates of visual and performing college-arts programs between 1990 and 2009; 2,817 were in the fine arts.

“Among the findings: Almost 83% worked the majority of their time in some arts occupation, such as art teaching or in a nonprofit arts organization.

“Arts graduates are resilient and resourceful,” says Curb Center Associate Director Steven J. Tepper. Sixty percent of the fine-arts graduates in the survey work more than one job, he says, “but they are happy with what they put together.” Bruno S. Frey, research director of the Center for Research in Economics, Management and the Arts at the University of Zurich, echoes that finding. He says he has done “happiness research for some time” and found that “artists generally are happier than the rest of the population.” Of all arts professions, fine artists, writers and composers were found to be the happiest, because “the profession they have chosen gives them autonomy, and that makes them happy,” he says. “Actors and musicians, on the other hand, are less happy, because they are disciplined by various rules and have less autonomy.”


More at: http://online.wsj.com/news/articles/SB10001424052702304402104579149060054918936

Child care costs outpace family income

In 2012, the cost of child care in the U.S. grew up to eight times faster than family income, according to a new study of the average fees paid to child care centers and family child care homes, reports NPR.

“Child care is an increasingly difficult financial burden for working families to bear,” said Lynette M. Fraga, executive director of Child Care Aware of America, a nonprofit research and advocacy group. “Unlike all other areas of education investment, including higher education, families pay the majority of costs for early education.”

“According to the new findings, some families are spending more on child care than on food or rent, as NPR’s Jennifer Ludden reports for our Newscast unit:

“In most states, average child care center fees for an infant are higher than a year’s tuition and fees at a public college. …

“Factor in two kids, and the study finds average fees higher than the median rent in all states, and higher than the average food bill in all regions.”

In compiling its report, Child Care Aware of America looked at the costs of child care centers, including those run by religious organizations and family care homes. The findings don’t include other options such as nannies, or friends and relatives who look after children. To compare the costs of caring for two children, the organization used data from the price of care for an infant and a 4-year-old. The study ranked U.S. states according to the affordability of child care (as a share of median income for single or married parents), not by the overall cost of child care.

“The dollar cost of center-based care for infants was actually highest in Massachusetts” at nearly $16,500 yearly, according to the report, “compared to just over $13,450 per year in Oregon; however, as a percentage of median income for married couples with children, care was least affordable in Oregon.” Oregon was also found to be the least affordable state for center-based care for a married couple with a 4-year-old, ahead of New York, Minnesota and Vermont. The overall price of raising kids has also risen, according to government figures. Parents who had a child in 2012 can expect to pay $241,080 to raise him or her for the next 17 years, as Eyder reported for The Two-Way this past summer.The high numbers may cause parents to groan, but Child Care Aware of America says it doesn’t see cheaper child care as the sole solution.”


More at: http://www.npr.org/blogs/thetwo-way/2013/11/04/243005358/child-care-costs-already-high-outpace-family-income-gains?ft=1&f=1001

Interdisciplinary losers

Everyone, it seems, loves the idea of scholars interdisciplinary work. But does academe reward those — particular young scholars — who actually do it?images

A new study, based on data from all people who earned Ph.D.s in 2010, suggests the opposite, reports InsideHigherEd

“In the year after earning their doctorates, those in the cohort who did interdisciplinary dissertations earned, on average, $1,700 less than those who completed dissertations in a single field. The study was conducted by Kevin M. Kniffin and Andrew S. Hanks, two postdoctoral fellows at Cornell University, and has been released by the Cornell Higher Education Research Institute.

“Kniffin and Hanks used data from the Survey of Earned Doctorates, and focused on the more than 26,000 people who earned doctorates that year who are U.S. citizens. The income of new Ph.D.s, of course, varies by such factors as discipline, whether postdoctoral employment is within academe or outside it, and whether the first job after the Ph.D. is a postdoctoral fellowship. Kniffin and Hanks came up with their $1,700 gap by controlling for discipline, age, gender and ethnicity. They reasoned that because some disciplines are more likely than others to produce new doctorates who seek employment outside academe, they could address various differences in post-graduation patterns of various new doctorate holders.

“The Survey of Earned Doctorates specifically asks if new Ph.D.s did a multidisciplinary dissertation, so that information was readily available for the study. Continue reading “Interdisciplinary losers”

World income declines

Personal income in the world went down in the last year, as reported today from Gallup.

“Twenty-six percent of the world’s adult population was employed full time for an employer in 2012, down slightly from 27% a year ago. imgresThis decline reverses the upward trend in Gallup’s Payroll to Population (P2P) measure since the height of the global recession in 2009.

“Gallup’s P2P metric estimates the percentage of the adult population aged 15 and older — not just those currently in the workforce — who are employed full time for an employer for at least 30 hours per week. Gallup does not seasonally adjust its P2P metric. Gallup does not count adults who are self-employed, working part time, unemployed, or out of the workforce as payroll-employed in the P2P metric.

“The percentage of people working full time for themselves was 18% in 2012, a slight decline over 2011 (19%). Thirty-eight percent were out of the workforce (38%), up slightly over 37% in 2011.

“On a regional basis, Northern America, made up of the U.S. and Canada, has the highest P2P rate (42%) of all regions in 2012, followed the group of European countries and areas not in the European Union (40%), which includes Switzerland, Norway, Iceland, and North Cyprus. In both regions, 5% of the population is self-employed, while approximately one-third is not actively participating in the workforce.”


More at: http://www.gallup.com/poll/163841/global-payroll-population-rate-drops-2012.aspx?utm_source=feedly

College student poverty

According to the National Center for Education Statistics, 29 percent of students nationwide have household incomes below $20,000, 79 percent work full or part time in addition to taking classes, and 35 percent are parents or have dependents (17 percent are single parents). ThinkProgress reports that “These financial burdens can constrain college students’ potential. Many are forced to drop out of school, creating a vicious cycle of poverty because without education, it is increasingly difficult to emerge out of poverty and enter the middle class.images

“Overall, more college students are having to work long hours to finance their educations. The American Community Survey found that in 2011, 19.6 of undergraduates nationwide worked a full-time, year-round job. By contrast, in 2005, just under 10 percent of college students were working full time.

“The Census paper also notes that 63.3 percent of college students live with their parents or relatives, suggesting that the sluggish economy is making it difficult for students to attend college further from home and live on their ownPoverty rates in many areas of the country decline significantly when they exclude off-campus college students living on their own, a new Census Bureau working paper finds.The Census Bureau calculated that 15.2 percent of the population officially lives in poverty. But for college students living off-campus and not living with relatives, the poverty rate is 51.8 percent. When eliminating them from the official poverty rate calculation, only 14.5 percent of Americans live below the poverty level.College students who live in dorms are automatically eliminated from calculations of the poverty rate, but students living off-campus are not, so the Census Bureau isolated data for these students recorded by the American Community Survey from 2009 to 2011. Continue reading “College student poverty”

U.S. leads world in income inequity

Wealth data is not easy to get.

Still for three years now, Credit Suisse Research Institute has published an annual Global Wealth Databook which attempts to estimate global wealth holdings.

As posted today in Sociological Images: “The most recent issue includes data covering 2012.  According to Credit Suisse, the goal “is to provide the best available estimates of the wealth holdings of households around the world for the period since the year 2000.”

imgres-1

“According to the publication, global household wealth was $222.7 trillion in mid-2012, equal to $48,500 for each of the 4.6 billion adults in the world.  Wealth is defined as “the marketable value of financial assets plus non-financial assets (principally housing and land) less debts.”

“Not surprisingly, average global wealth varies considerably across countries and regions. Continue reading “U.S. leads world in income inequity”

Facts about artists

Instagram and Etsy have made everyone seem like artistic geniuses, but according to the National Endowment for the Arts, artists make up only 1.4 percent of the U.S. labor force. “Last week, we learned a lot more about the roughly 2 million artists in the workforce thanks to the NEA study,  “Equal Opportunity Data Mining: National Statistics about Working Artists.” imgresAs reported bu the Washington Post, “The study, based on Census data, classifies artists by occupation, demographics and region. The NEA also provides this handy interactive map, which ranks states according to artists as a share of the state’s total labor force. Here are five of the more surprising findings.

“Congratulations, California. You’re still an artist haven, with Los Angeles and San Francisco boasting the highest percentages of artists in their workforces, according to the NEA’s city-to-city comparison. Artists make up 4.86 percent of the Los Angeles workforce and 4.3 percent of San Francisco’s. The third-ranked city? That would be Santa Fe, New Mexico, with artists making up 4 percent of all workers.

“New York City is home to more artists than any other U.S. city, with 140,915 people engaged in artistic professions, but with a workforce of 4.1 million people, that’s only 3.4 percent of its total workforce. In fact, New York City has only a slightly higher percentage of working artists per capita than Washington, D.C., where artists make up 3.1 percent of the workforce. (This may seem unlikely, considering that the New York data include Brooklyn. But remember that the New York metro area is enormous. And to count, artists had to report income or be actively pursuing work as a primary profession, which means thousands of aspiring poets in Williamsburg were probably excluded.) Continue reading “Facts about artists”

Young and downwardly mobile

Young working-class men and women are trying to figure out what it means to be an adult in a world of disappearing jobs, soaring education costs and shrinking social support networks. Today, only 20 percent of men and women between 18 and 29 are married. They live at home longer, spend more years in college, change jobs more frequently and start families later.

Before reading any further, a spoiler alert: today’s New York Times carries no few than four articles about the poor prospects for young people, the skyrocketing costs of education, the uselessness of a college degree. That said:

“For more affluent young adults, this may look a lot like freedom. But for the hundred-some working-class 20- and 30-somethings I interviewed between 2008 and 2010 in Lowell and Richmond, Va., at gas stations, fast-food chains, community colleges and temp agencies, the view is very different.

“Lowell and Richmond embody many of the structural forces, like deindustrialization and declining blue-collar jobs, that frame working-class young people’s attempts to come of age in America today. The economic hardships of these men and women, both white and black, have been well documented. But often overlooked are what the sociologists Richard Sennett and Jonathan Cobb in 1972 called their “hidden injuries” — the difficult-to-measure social costs borne by working-class youths as they struggle to forge stable and meaningful adult lives. Continue reading “Young and downwardly mobile”

Why the minimum wage matters

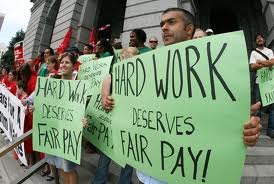
Three and a half million people of color would be lifted out of poverty if Congress raised the minimum wage to $10.10, according to a new report from the restaurant workers’ group ROC United. According to a recent post on ThinkProgress:  “This would be the majority of the six million people overall who would be lifted out of poverty. People of color are far more likely to work minimum wage jobs, as they represent 42 percent of those earners even though they make up just 32 percent of the workforce.images

“That big number is in large part thanks to the overrepresentation of people of color in low-wage restaurant industry jobs. Over 500,000 of those lifted out of poverty by a raise in the minimum wage would be restaurant workers, 300,000 of whom would be workers of color.

“Restaurants are the single largest employer of people of color, but they are disproportionately concentrated in the lowest paying positions. As the report notes, “Two of the lowest-paying jobs, dishwashers and fast food preps and cooks, are 59% and 35% people of color, and earn a median wage of $8.78 and $8.85, respectively.” Forty percent of tipped workers — who make an even lower minimum wage of $2.13 — are people of color.

“The people of color who hold these jobs are also more likely to live in poverty. They make up more than half of tipped workers and restaurant workers with incomes below the poverty line.”


Read full story at: http://thinkprogress.org/economy/2013/06/21/2194701/race-minimum-wage/

Wealthy humanities & arts students

Ok, so the humanities and art draw from wealthier student cohorts. How will this shape what knowledge matters in the future?imgres

Money has always given people better options, but for humanities and arts graduate students, money’s now necessary just to get acceptable ones, reports Inside Higher Ed. “Just now becoming noticeable, this “re-gilded ivory tower” looms over a landscape that everyone should consider.

“As one fellow graduate student recently observed, “You have to have a spouse nowadays; that’s how more and more people seem to be doing it.” As is well-known, the economic crash hastened the decline of tenure-track jobs and increased competition for them. Once standard, these stable jobs with adequate salary and benefits have become rarer, displaced by short-term, one- to two-year positions at best, and by piecemeal adjuncting at worst. In turn, entry-level qualifications also rose at some institutions to include a secondary research specialization, at least one article, and attention to pedagogy resulting in the creation of one or more substantive classes, ideally taught at outside institutions. Continue reading “Wealthy humanities & arts students”

Separate yet unequal

Higher education is increasing divided by economic class.

It’s been almost 60 years since the 1954 Supreme Court decision Brown vs. Board of Education led to the dismantling of segregated schools in the South, reports Huff Post College.  “While legal segregation was halted, public schools especially in large cities have become increasingly segregated by circumstance. Now higher education is under scrutiny for having established a segregated system, this time primarily by socio-economic status.Unknown

“While undergraduate higher education in the U.S. can be parsed in a variety of ways, the biggest division is between the growing community college segment and that of four year public and private universities and colleges. Surprising to many, community colleges enroll 45% of all undergraduates and that fraction is growing. Moreover, the majority of all black and Latino undergraduates are enrolled at community colleges.

“Compared with students at senior institutions, community college students come from markedly poorer families. The details are documented in new research, Bridging the Higher Education Divide, by The Century Foundation. The report’s conclusion is clear: four year colleges, especially the elite privates, draw primarily from the top income brackets, while community college students come primarily from lower income groups. And since 1982 the gap is widening with fewer community college students coming from the top fourth of the income scale.

“Moreover, community colleges are neglected when it comes to federal and state funding. Thus expenditures by the federal government go primarily to private and public research institutions and state support per student is typically higher at state universities compared with community colleges. Continue reading “Separate yet unequal”

Women as breadwinners at record high

Pew Research Center published an interesting report this week noting that women are now the sole or primary source of family income in 40% of U.S. households with children — a record high reports Maddow Blog.  “As Emily Arrowood explained, Fox host Lou Dobbs and his all-male panel of guests did not take the news well.images-1

“The clip has to be seen to be believed, but for those who can’t watch clips online, Dobbs said the Pew report is evidence of “society dissolving around us.” Juan Williams said the more women become the “primary bread winner,” the more we see “the disintegration of marriage.” He added, “Left, right, I don’t see how you can argue this.”

“Erick Erickson went even further:

“I am so used to liberals telling conservatives that they are anti-science. But I mean this is — liberals who defend this and say it’s not a bad thing are very anti-science. When you look at biology, look at the natural world, the roles of a male and female in society; in other animals the male typically is the dominant role, the female is not antithesis or is not competing; it’s a complementary role.” Continue reading “Women as breadwinners at record high”

One quarter in U.S. struggle to afford food

A new Pew Research report on emerging economies finds that almost a quarter of Americans have trouble affording food. “This reported level of deprivation is closer to that in Indonesia or Greece rather than Britain or Canada,” the report says.

Why is this the case?

Quartz reports that “according to numbers from the USDA, the moderate costs to healthfully feed a family of four a week costs $191, including meals and snacks, up 38% from 10 years ago. Food inflation was about 5% last year after a drought led to an increase in corn, wheat, and soybean prices, which in turned raised the price of chicken, pork, and beef. With continued unpredictability in weather affecting crops and higher demand from a growing population, it’s likely that food prices will only continue to rise.images

“But the US has the worst income inequality among developed economies; 15% of the population uses food stamps. As economist, Joseph Stiglitz has argued, the income inequality in the US is not only holding back a recovery but also setting up the nation for future economic instability.

“The technorati is busy brewing up a single-source omnifood, the FAO has been urging people for years to eat insects, and NASA wants astronauts to eat 3D-printed food. But here on earth, an estimated 40% of the food produced in the US is wasted.”


More at: http://qz.com/87761/almost-a-quarter-of-americans-struggle-to-afford-food/

No wealthy child left behind

Here’s a fact that may not surprise you: the children of the rich perform better in school, on average, than children from middle-class or poor families. As today’s New York Times puts it: “Students growing up in richer families have better grades and higher standardized test scores, on average, than poorer students; they also have higher rates of participation in extracurricular activities and school leadership positions, higher graduation rates and higher rates of college enrollment and completion.

“Whether you think it deeply unjust, lamentable but inevitable, or obvious and unproblematic, this is hardly news. It is true in most societies and has been true in the United States for at least as long as we have thought to ask the question and had sufficient data to verify the answer.

“What is news is that in the United States over the last few decades these differences in educational success between high- and lower-income students have grown substantially. Continue reading “No wealthy child left behind”

How economy is hitting older people

Young graduates are in debt, out of work and on their parents’ couches.

People in their 30s and 40s can’t afford to buy homes or have children.Retirees are earning nea

r-zero interest on their savings. Today’s New York times carries a sobering story about the way the economy is hitting people just under retirement age:

imgres-1

“In the current listless economy, every generation has a claim to having been most injured. But the Labor Department’s latest jobs snapshot and other recent data reports present a strong case for crowning baby boomers as the greatest victims of the recession and its grim aftermath. Continue reading “How economy is hitting older people”

Women as breadwinners in North Korea

“In the past, our husbands would bring home rations, and we’d live off that,” says Mrs. Kim. “Now there are no rations, and the women support the families. If we don’t make money, they starve, so life is hard for women.”

It’s no secret that in many nations women are outpacing men in education and the workplace, despite being paid less. Indeed, a continuing revision of gender roles koreanseems to be occurring across a wide variety of cultures, often for varying reasons. Today’s npr.org features a story on women and the workplace in North Korea:

“Imagine going to work every day and not getting paid. Then, one day, you’re told there’s no work to do — so you must pay the company for the privilege of not working. Continue reading “Women as breadwinners in North Korea”